
✅ Current for tax year 2026
Quick answer: Type in a starting amount, a monthly contribution, the years you will invest and the yearly return you want to test. The calculator below shows what a broad S&P 500 fund could grow to before taxes and after the federal tax on dividends and on the sale. Most online S&P 500 calculators stop at the first number. In a regular brokerage account the second number is the one you can actually spend.
In this guide
- Try the calculator
- What each box means
- Example: $10,000 plus $500 a month for 20 years
- Where the tax comes from
- How much your tax rate changes the result
- How time changes the picture
- Taxable account or retirement account?
- Choosing a return to test
- What the calculator leaves out
- What you report on your return
- Common questions
Try the calculator
The numbers in the boxes are examples you can change. Nothing you type leaves your browser.
This calculator needs JavaScript.
If you want to see how your result changes, try a lower and a higher return than the one you expect. Real markets do not deliver the same return every year, so a range tells you more than a single answer.
What each box means
- Starting amount and monthly amount. What you invest on day one and what you add each month. The calculator adds each month’s contribution before that month’s growth.
- Years invested. From 1 to 60 years.
- Average annual total return. Your own assumption, with dividends included. It is not a forecast, and the calculator does not suggest one.
- Fund fee. The expense ratio of the fund, as a percentage per year. It is taken out of the return. Look it up in the fund’s fact sheet.
- Dividend yield. How much of the return is paid out as dividends each year. This part is taxed every year, even when the dividends are reinvested automatically.
- Tax rate on dividends and long-term capital gains rate. You choose 0%, 15% or 20%. Which one applies to you depends on your taxable income and filing status. The capital gains tax rates guide shows the thresholds, and IRS Topic 404 explains that qualified dividends are taxed at the lower capital gain rates.
- The 3.8% box. Check it if your modified adjusted gross income is above the net investment income tax threshold of $200,000 for single filers or $250,000 for married couples filing jointly (IRS Topic 559). The calculator adds 3.8 percentage points to both rates, which is a simplification: the surtax applies only to the lesser of your investment income or the amount your income is over the threshold.
- Inflation. Optional. If you enter a rate, you also get the after-tax value in today’s dollars.
Example: $10,000 plus $500 a month for 20 years
These results come from the calculator above with a $10,000 start, $500 a month, 20 years, a 0.05% fund fee, a 1.5% dividend yield, and 15% on both dividends and the final sale. The only thing changed between the rows is the assumed yearly return. They are illustrations of how the math works, not predictions.
| Assumed yearly return | Balance before taxes | Dividend tax along the way | Tax at the sale | Value after taxes | Taxes’ share of the growth |
|---|---|---|---|---|---|
| 5% | $228,884 | $4,510 | $10,047 | $212,490 | 16.6% |
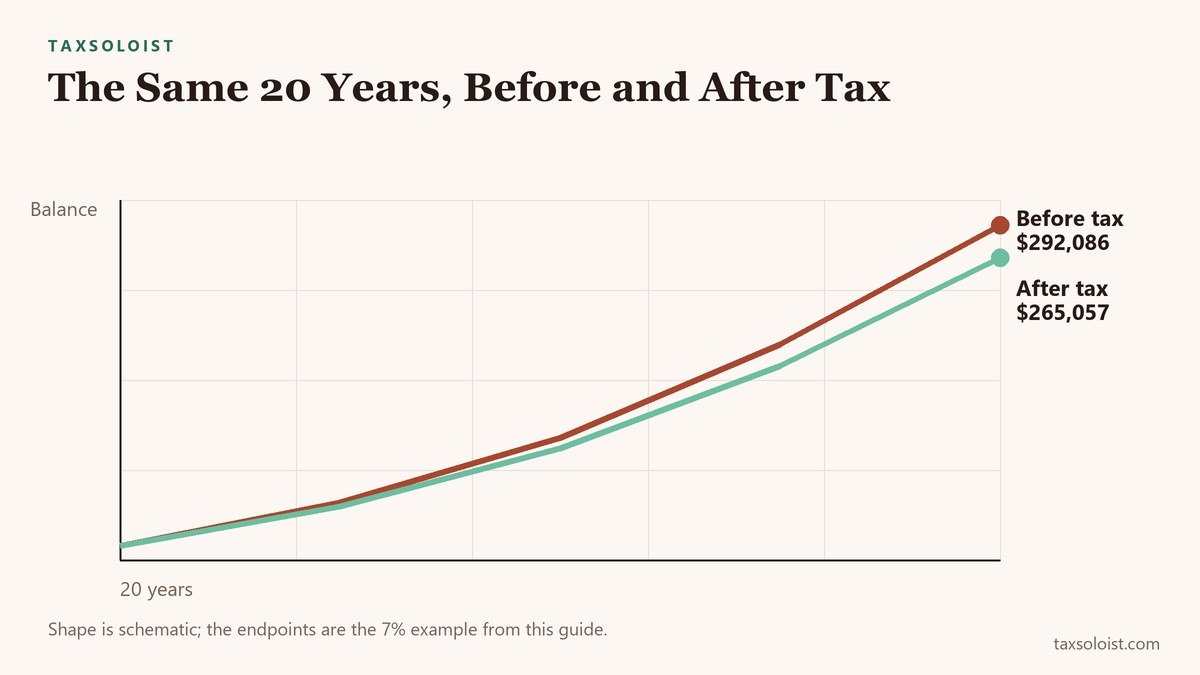
| 7% | $292,086 | $5,306 | $18,528 | $265,057 | 16.7% |
| 10% | $426,520 | $6,856 | $36,670 | $376,647 | 16.8% |
Notice two things. Taxes take roughly a sixth of the growth in every row. And the cost of taxes is bigger than the dividend tax and the sale tax added together, because money paid in tax along the way stops compounding. In the 7% row the two tax lines add up to $23,834, but the balance ends $27,029 lower.
Where the tax comes from
An S&P 500 fund creates tax in two places.
- Dividends, every year. The companies in the index pay dividends, the fund passes them to you, and you owe tax on them in the year they are paid, even if you reinvest every cent. Your fund reports them on Form 1099-DIV. Qualified dividends are taxed at the lower long-term capital gain rates, and the rest are taxed like ordinary income. Publication 550 has a section on dividends used to buy more stock if you want the detail.
- The sale, when you cash out. The gain is what you sell for minus your cost basis, which is what you paid plus the dividends you already paid tax on and reinvested. Hold the shares for more than one year and the profit is a long-term gain taxed at 0%, 15% or 20%. Sell after a year or less and it is a short-term gain, taxed at your regular bracket (IRS Topic 409).
Which rate lands on your gain also depends on how it stacks on top of the rest of your income. Our guide to effective versus marginal tax rates explains why the last dollar of income is not taxed at the same rate as the first. If a large sale pushes up your income in one year, you may also owe an estimated payment, which our estimated tax guide walks through.
How much your tax rate changes the result
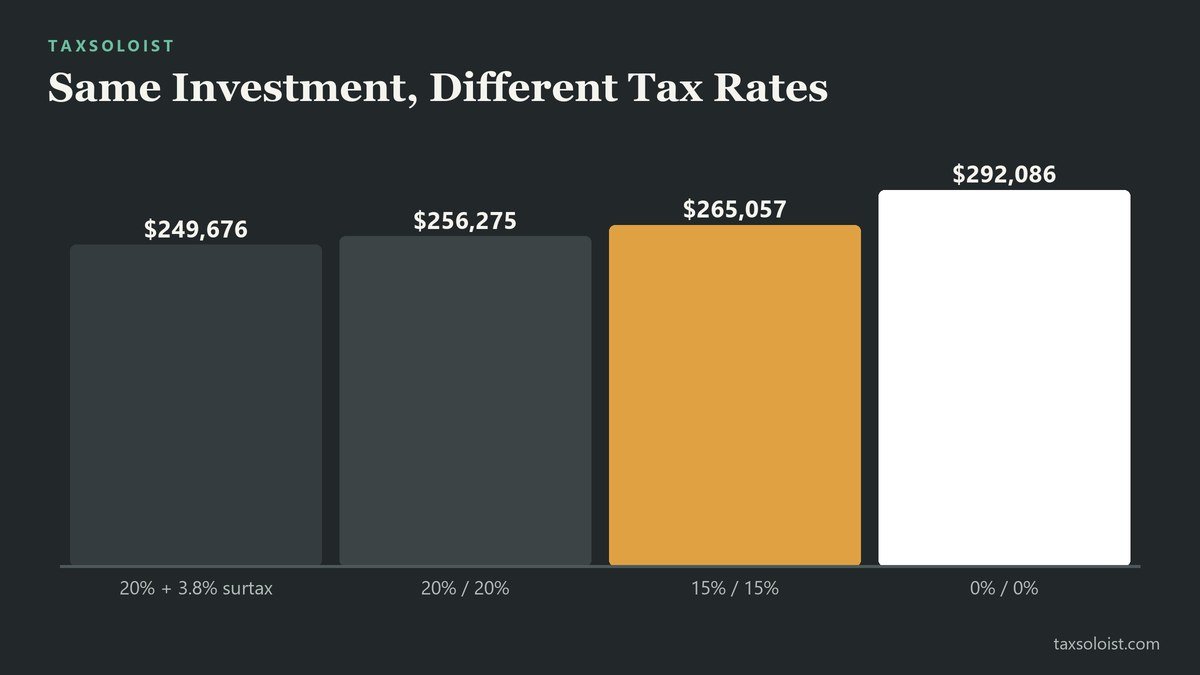
Here is the same 7% example with different rates. The balance before taxes does not change, but what you keep does.
| Tax rates used (dividends / sale) | Dividend tax along the way | Tax at the sale | Value after taxes | Taxes’ share of the growth |
|---|---|---|---|---|
| 0% / 0% | $0 | $0 | $292,086 | 0% |
| 15% / 15% | $5,306 | $18,528 | $265,057 | 16.7% |
| 20% / 20% | $7,028 | $24,541 | $256,275 | 22.1% |
| 20% plus the 3.8% surtax / same | $8,321 | $29,058 | $249,676 | 26.2% |
The gap between the first and last row is $42,410 on the same investment. That is why it is worth knowing where your income puts you before you decide how much to invest in a taxable account. If you are not sure, run the calculator with two rates and look at the range.
How time changes the picture
The same inputs for 10, 20 and 30 years, at 7% with 15% rates:
| Years invested | Total you put in | Balance before taxes | Dividend tax | Tax at the sale | Value after taxes | Taxes’ share of the growth |
|---|---|---|---|---|---|---|
| 10 | $70,000 | $105,364 | $1,170 | $4,085 | $99,780 | 15.8% |
| 20 | $130,000 | $292,086 | $5,306 | $18,528 | $265,057 | 16.7% |
| 30 | $190,000 | $657,683 | $15,120 | $52,800 | $574,884 | 17.7% |
The share of the growth that goes to taxes rises slowly with time, from 15.8% to 17.7%, because more of the final balance is untaxed gain waiting for the sale. The more important number is the one in the second column: most of a 30-year result comes from growth, not from the money you put in.
Taxable account or retirement account?
This calculator models a regular brokerage account. If you hold the same fund in a traditional IRA or 401(k), you do not pay tax on dividends or gains each year, and you pay ordinary income tax when you withdraw (see our guide to tax on IRA and 401(k) withdrawals). In a Roth account, qualified withdrawals are generally tax-free. To see the no-tax case, set both rates to 0% and compare it with your taxable result. The choice of account can matter as much as the choice of fund. If you work for yourself, our Solo 401(k) versus SEP IRA comparison covers the accounts open to you.
Choosing a return to test
Nobody knows what the next 10 or 20 years will return, and that includes anyone selling a calculator. Instead of looking for the right number, test a low case, a middle case and a high case, and decide whether you could live with the low one. Look at many years of annual returns from a reliable data source, not just a long-term average, and notice how far single years swing above and below it. A calculator that applies the same return every year is smooth. A real account is not, and a bad stretch early in the plan hurts more than the same stretch later.
What the calculator leaves out
- State and local income tax. The estimate is federal only.
- Tax paid from the account. In real life you may pay dividend tax from other money, which would leave more invested.
- Capital losses and other income. The calculator does not model losses, other gains, or changes in your tax bracket over the years.
- Your actual tax rate changing. The rates you pick stay the same for every year of the plan.
- Selling in pieces. It assumes you sell everything at the end. Selling over several years can lower the rate on part of the gain.
- Fund details. Fees, tracking differences and how a fund distributes gains vary from fund to fund.
It is a planning tool for comparing choices, not a substitute for a tax preparer who knows your whole return.
What you report on your return
Your broker sends Form 1099-DIV for dividends and Form 1099-B when you sell. You list the sale on Form 8949 and summarize your gains and losses on Schedule D (Form 1040), as IRS Topic 409 describes. Keep your purchase records, including reinvested dividends, because they set your cost basis. If you are not sure how a sale will stack up against your income this year, compare it with your standard deduction and the rest of your return before you sell.
Common questions
What return should I enter?
There is no safe answer, because nobody can predict future returns. Test a low, a middle and a high case, and use the results as a range.
Do I owe tax on S&P 500 growth every year?
You owe tax every year on the dividends. You owe tax on the price growth only when you sell, at the long-term capital gains rate if you held the shares more than a year.
If I reinvest my dividends, are they still taxed?
Yes. Reinvesting does not avoid tax on dividends. The reinvested money is added to your cost basis, which lowers the gain when you sell.
Why is the after-tax number lower by more than the tax lines add up to?
Tax paid each year on dividends leaves the account, so it stops growing. That lost growth is part of the cost of tax, and it is included in the gap between the before-tax and after-tax balance.
Can an IRA or 401(k) avoid this tax?
It changes when the tax is due. In traditional accounts you pay when you withdraw, and in Roth accounts qualified withdrawals are generally tax-free. Set both rates to 0% in the calculator to see the no-tax result.
Is this calculator tax advice?
No. It is a simple model for comparing scenarios. Your own tax situation may differ, so check your return or ask a tax professional before you act.